
Disclaimer: This page may contain some affiliate links. If you click through and purchase an item, we may earn a commission. Thank you for supporting Minded Marketing!
The last thing you want to do as a new blogger or website owner is to miss out on important Google Analytics metrics.
You may be thinking: “But I get barely any traffic!”
Guess what?
It doesn’t matter.
Even if you are getting only ONE page view per day, it is important to know where that pageview is coming from, how people are finding your content, and how you can use it to your advantage.
Now if you’re website is more like a personal journal and you are not looking to grow it into a business, then Google Analytics may be a bit unnecessary for you.
However, if your blog or website is going to be your livelihood and going to bring you any form of income, then having Google Analytics is a must.
If you are a beginner, then certain metrics are going to be more important than others. Trust me, it is easy to get lost in the Google Analytics sauce.
This is why I am writing this article to make sure you know which metrics you should focus on the most to begin with.
So with that being said, before we get into the metrics, let’s make sure you understand what Google Analytics is and how to set it up right.
What is Google Analytics Used for?
Google Analytics (GA for short) was made to help website owners keep track of their website activity in an all-in-one platform.
It provides in-depth into how people get to your website, how long they stay, what they do while they are on your pages, and even what page makes them leave.
You can see everything from real-time users to pageviews, to search queries in the GA dashboard.
It literally has 100’s of metrics that you can look at. As amazing as it is, it can be a bit overwhelming if you have never used it before.
When I first started out, I would just sit and stare at the dashboard hoping some sense would jump out at me.
Thankfully, the more I used it over the years, the better I got at it.
But I do wish that I had an article like this when I first started out.
What do metrics mean in Google Analytics?
Metrics in GA are specific measurements that are performance-based. Each metric, and its calculations, are based the actions that your viewer does from the moment they get onto your website to the moment they leave.
I hope I haven’t lost you yet.
Let me give you an example: There are metrics that show you if your viewer found you on Google or found you on social media.
There is also another metric that shows you how long they stayed on your website and what they clicked on while they were there.
Sounds pretty simple right?
Don’t worry we will get into each one in a moment so that you can get a better understanding of how it works.
But first, in order for these metrics to work, you have to give Google Analytics access to your site for it to be able to track what happens.
This is where the analytics code comes into play.
How to get your google analytics code
Getting your code from GA is super simple.
Log into your Google Analytics admin dashboard.
There you will see “Tracking Info.”
Click on that and you will see “Tracking Code.”

Under “Website Tracking” you should see something called the Global Site Tag. This is a line of text that is specific to you and your website.
It is very important that you add your website as a property in GA first. Otherwise, you won’t get access to this information.
How to install your Google Analytics code on your website.
Once you get this code, you simply need to copy the code that is given to you and enter it into the header section of your website.
If you are a WordPress user like me and you do not see the header section (or you just don’t feel comfortable navigating HTML) then you can install the Insert Header & Footer plug-in. With this, you will be able to easily add your strip of code.
Make sure that it is always the first line of code in the header section. Sometimes, if it is under any other codes, it could interfere with the stats.
Once all is set and done, it may take 24-48 hours for your stats to start coming in from GA which is why I urge that you do this as early as possible so that you don’t miss too much information.
Now that we got all of that out of the way, let’s focus on which metrics are going to be the most important for you once your numbers start rolling in.
The Most Important Google Analytics Metrics for Beginners

1. Pageviews
None of these are in any special order but this one deserves to be mentioned first because it is every blogger’s favorite.
As it should be!
Pageviews in GA shows you exactly how many views your pages got under a certain period of time. You can see how many views you got this month, the last couple of days, or even the whole year. It truly is up to you.

This is the stat that every once goes crazy over. I can tell you from first-hand experience, this is the most addicting part of using Google Analytics. I can log onto it every hour just to see if anything new is happening.
The only problem is, it has a delay in the analytics.
According to Google, there can be a delay of 24-48 hours before you get the real stats. This means that you may log in today and see that you have 0 visits to your pages. But in reality, you may have gotten a lot of page views.
I know how it feels so get a new blog post out, promote it, and not be able to see how it is performing.
Believe it or not, you will get used to it with time. You will quickly notice that real-time stats are not as easy to come by on any platform. You can choose to use something like JetPack which is a very popular plug-in. But just a fair warning, it can be pretty heavy on your site so keep that in mind.
2. Acquisition: Traffic Channels
Under the Acquisition tab, you will find Traffic and then Channels.
Here, you will be able to see where your traffic is coming from through 4 main channels:
- Direct
- Organic Search
- Social
- Referral

If you find that you are getting Direct Traffic, it generally means that there was no referral for that visit. The visitor may have directly searched for your website or entered your domain name to get to your page.
Organic Search means that the person searched a keyword and ended up on your page. Hopefully, this means that you did some good SEO work on your article which landed you a spot on Google’s SERP.
If you find that you are getting traffic from Social, then this means that visitors are finding you through your social media platforms. This is important because it will clearly show you which social media platform is worth putting more effort into.
Referral Traffic means that you are getting traffic from another website that is linking back to your platform. This is not the same as social media platforms. It’s more like getting backlinks to your site (which is a good thing)!
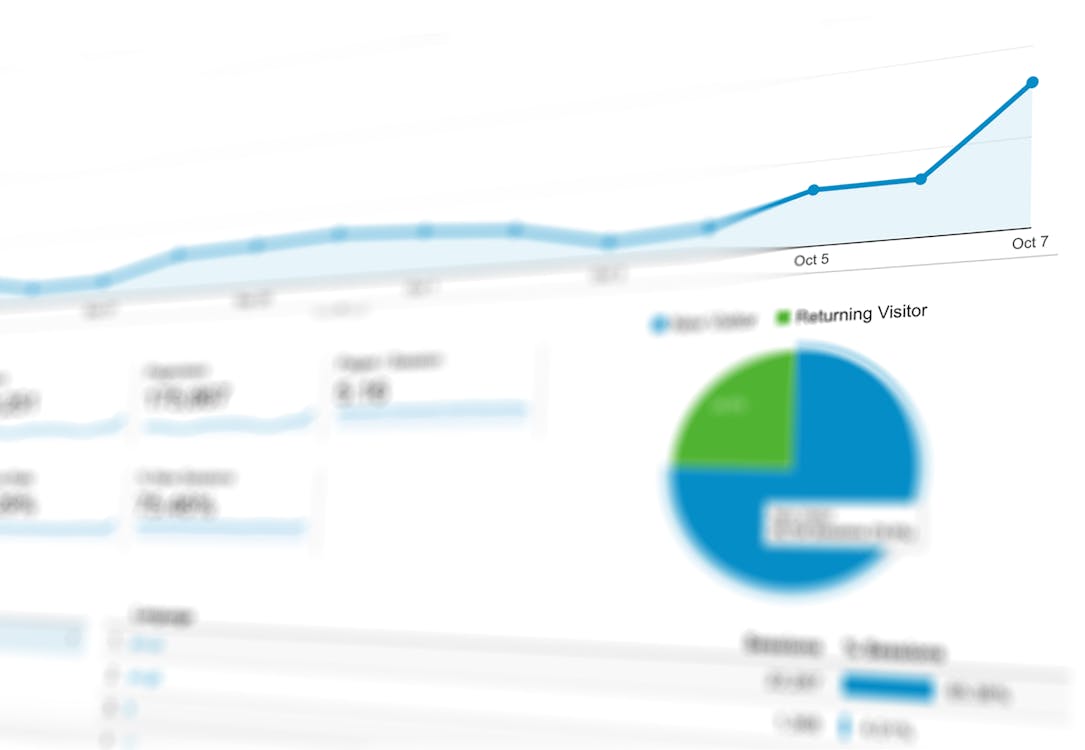
3. New vs Returning Visitors
This one is pretty self-explanatory.
New vs Returning users shows you how many of your users (or viewers) were new to your website, versus how many had been on your site before.
Since I am a Youtuber, I am used to seeing these metrics since they are the same in Creator Studio.
If you have an e-commerce store or you are building an email list, seeing returning users is a great way for you to know if people like your content and if your email campaigns are working in your favor.

However, seeing new users is also very important because these new viewers will someday turn into returning customers and subscribers.
This is why setting up an email marketing platform to grow your list is very important right when you begin. Every new user can turn into a new subscriber if you play your cards right.
If you want to learn how to set up an email marketing system COMPLETELY FOR FREE then I suggest you read my last post where I walk you through how to do that.
There is no way to grow an online business without new people coming to your page and developing trust with your users.
4. Users/Sessions
It took me a while to understand the difference between users and sessions when I first got GA.
When it comes to the term “users”, it means measuring each individual that is visiting your website. Each user will usually get you 1 pageview at least.
The moment they land on your page (and don’t bounce), a session is created and timed by Google Analytics.

A session is the amount of time that the user has actively been on your page.
That means scrolling through your page, clicking on different links on your site, and actively engaging with your content.
So each session can have several pageviews.
The goal is to have people not only come to your website but also stay there as long as you can. So linking to other blogs and writing long and informative blog posts that help people will help boost your session a lot.
It will also increase the value of your website in the future so ad networks will be willing to pay more to get their ads on your website.
5. Bounce Rate
Bounce Rate in GA determines the rate at which people land on your site and then leave without any other engagement.
This can mean several things and often leaves new bloggers a little confused.
I know I was.

I thought that having a high bounce rate was bad. I thought it meant that people were coming to my page and clicking of almost directly. I would see that somedays, I would have a bounce rate of 100%.
Yikes!
But this does not mean what you think it does.
In fact, the reader may have landed on your article which was specific to what they needed, read through the entire page, and then left.
Believe it or not, this is a bounce rate of 100% according to Google Analytics.
Why?
Because it is a single-page session.
But even though bounce rate may not determine the quality of your content, you do want to work towards getting a lower bounce rate and increasing your session times.
The reason is, a bounce rate of 100% also gives you a session duration of 0 in GA. This makes sense because a session is only created when people click through to other things on your site.
If the reader doesn’t engage, no session is created.

However, getting a bounce rate of 0% is also almost impossible. Matter of fact, if you see this then you may actually have a problem with your stats.
According to SemRush, an optimal bounce rate is anything from 26% to 40%.
If you want to increase the value of your site in the future, then you will want to make sure your bounce rate is lower and your sessions durations are longer.
6. Average Session Duration
Average Session Duration is the amount of time your uses spend on your website in general. It is pretty self-explanatory and not too complicated to understand.
We all know that people tend to skim through articles. However, you still want to make sure that the article is well-written and informative so that the viewer may “skim” a little slower and actually read the whole thing.

Why is having a longer session duration important?
Well as a creator, you are putting your art and self-expression into your content. So obviously, you want as much of it to be seen as possible.
You should aim for sessions where people look through and read several articles on your website. If your sessions are longer, this generally means that people are actually finding what they need on your website.
If they are very short, it may show that people are not finding what they are looking for or that your writing is just not enticing them to stay any longer.
When you look at the session, you are able to see which pages are also viewed the most, which pages have the longest sessions, and which have the shortest sessions.
Study the pages that give you longer durations and see what you can take from them and incorporate them into the pages that have shorter sessions.
You will be able to find a trend and see what keeps your readers engaged.
7. Search Console Queries
The number one goal of any website owner should be to show up organically in search results. This is why you should connect your Google Analytics account to Google Search Console or Bing Webmaster Tools.
These reports will give you great insight into how your pages are found in organic search.
In GA, if you pair it with Search Console, you will be able to see what search terms and keywords people are typing to get to your content under Search Console Queries.
You will also be able to see how you are ranking, how many impressions you are getting, and your average CTR (click-through rate).

This information is vital.
You can take the keywords that are giving you the most clicks and that you are ranking the highest for and use those to make more content.
When it comes to analyzing these metrics, the end goal is finding what is working for you and using it to get better.
If you don’t want to use the same keyword again, use a similar keyword research process to find other keywords that interest you and use a similar SEO strategy to rank for other keywords.
If you have something that works, keep it!
8. Behavior Flow
This is a metric that is often overlooked in Google Analytics but it is very important.
Behavior Flow shows you how your readers and viewers generally move and engage on your site.
You will be able to see which page they land on, where they click next, which pages they click off of, and which internal links they engage with.

Use this information to see which pages people drop off the most and try to understand why. Maybe the writing could have been done better? Or maybe there was an opt-in that was off-putting?
You can also think about which page people migrate to the most. What can you do with that page? Should you put a special offer there so that people can get a discount? Or maybe give a freebie so that they will join your email list?
Take the time to study this metric and see how you can use it to your advantage.
9. Landing Pages
This is another one of those metrics that are easy to overlook.
Like the name states, Landing Pages is where you can see which page your viewers land on first.
You will be able to see how people got to that page and how long they stayed.

Once you see this information, start asking yourself:
- What pages do people land on the most?
- How did they get there?
- Which pages keep my audience engaged the most?
- What titles yielded the most click-throughs?
If you are able to answer all of these questions, then you may just have found your golden ticket to getting more views and clicks to your content.
10. Sessions by Channel
Sessions by channel show you your session times depending on which channel they come through.
Does it look like you get most of your traffic through Organic Search?
Great! Now you can use your SEO strategy and perfect it to get your other pages ranking as well.
Or maybe you notice that you are getting a lot of views from one specific social media platform.

Then you can decide to shift your focus more on that platform and maybe put the others on the back burner since they are not giving you what you need.
I find that Quora and Organic Search tend to bring me the longest session times.
But obviously, this depends on the kind of content you make.
This is why it is important to look into these metrics as well.
11. All Pages
This metric is another beginner favorite.
All Pages shows you a listing of all of the pages that got hits during your selected period of time, as well as how many page views they got.
As much as we may think pageviews are for vanity purposes, they actually mean a lot to anyone who owns an online platform.
It shows that something you are doing is working.

So when you look at the All Pages metric, you can see exactly how many views each page has and how the long average session time on that page is.
You will also be able to see how much that page has participated in your overall pageviews.
For example, let’s say you have a total of 1000 pageviews under a 30 day period. You notice that one page has had 60 views and another has had 300. This means that the first page is responsible for a total of 6% of your page views, whereas the second page brings you 30% of your page views.
Knowing this, you can now start to look for why this page is doing well. Has it been around longer? Did you promote it anywhere special?
These are the kind of questions you need to ask to learn from your statistics.
Final Thought About Google Analytics Metrics
I always say:
Statistics are meant to be analyzed. Not just looked at.
If you only knew how much your own statistics could teach you about your own content and how to make it better, then you would never look at stats the same!
That is what I am hoping this article will do for you.
Your statistics will teach you everything you need to know about how your SEO is working for you, how people are finding your content, how you can get more visitors, and so much more!
So do not sleep on them!
In the blogging world, people tend to say that 20% of your time should be spent creating content, and 80% of your time should be spent promoting.
I disagree.
I say, 20% of your time should be spent creating, 20% analyzing your statistics, and 60% promoting.
You can get a million people to come to your page. The key is getting them to stay.


Pingback: How to Exclude Internal Traffic From Google Analytics (EASY)